Contents
Introduction
Let’s play a game first! 🎮
You are a farmer with eight years of experience and a stable rice field. One day, you discover a new farming method on the market that can accelerate the growth and harvest of rice. However, this does not necessarily guarantee an increase in final profits due to potential changes in yield or quality. Over time, this new farming method gains popularity, and you begin to worry whether other farms adopting this method will change the market dynamics, impacting your own rice farm. On the other hand, if you decide to adopt this new method yourself, the outcomes remain uncertain. Torn between maintaining your current approach and embracing change, what choice will you make?

This is precisely the dilemma YouTubers faced in 2013.

What’s going on in 2013?
The year 2013 is considered the dawn of the short video era. With the advancement of smartphone technology, people can easily use their phones to watch videos anytime and anywhere. That same year, Vine pioneered the concept of 6-second videos, quickly gaining traction among young audiences and sparking a wave of imitators. Soon after, Instagram followed by launching 15-second videos to attract users, which led to the rapid popularization of short video culture. Following Vine’s success, TikTok emerged as a leader in the short video space with its 60-second videos, establishing itself as the new giant in the field. The rapid growth of multiple short video platforms inevitably impacted YouTube, the long-standing leader in the video domain.
However, YouTube’s response to the short video trend was relatively slow. It wasn’t until 2020 that YouTube launched Shorts to capture the audience drawn to short video culture. By analyzing the YouNiverse dataset, which includes YouTube video data from 2005 to 2019, we can explore the impact of the short video wave on YouTube creators.
Duration Analysis
Choosing the Right Way
Just as farmers choose different methods to manage their rice fields, YouTubers must decide on the optimal video durations to adopt. We preprocessed the dataset and filtered it to include only English-language channels for analysis. It is undeniable that the rise of short videos has influenced user preferences for video durations. However, the question remains: does this mean users are increasingly favoring short videos? Or have short-video enthusiasts migrated to other platforms, leaving YouTube with an audience that prefers longer videos? Furthermore, could YouTube’s delayed response to short videos be based on data-driven insights suggesting that short videos have not significantly impacted its growth?
To address these questions, we use 2013 as a critical time point to analyze the optimal video durations on YouTube before and after the short-video boom. We introduce the “popular score” as a metric to measure whether a video is trending, aiming to explore how YouTubers’ choices of video duration influence video performance.
Videa Popularity Score: For each video, a preliminary method to evaluate the popular degree of a video was obtained by normalizing and redistributing different weights based on the number of views, likes, and comments:
\[PS = k_1\frac{\ln(1+V)}{\ln(1+V_{max})} + k_2\frac{\ln(1+L)}{\ln(1+L_{max})} + k_3\frac{\ln(1+C)}{\ln(1+C_{max})}\]where:
- \(V\) = views
- \(L\) = likes
- \(C\) = comments
\(V_{max}, L_{max}, C_{max}\) = maximum values across dataset
The \(\ln(1+x)\) transformation reduces skewness.
Data Distribution
Balancing the Fields
Just as farmers evaluate rice field management strategies by observing the final performance of different farms, our video data is akin to the performance records collected from various rice fields. However, analyzing every aspect of all rice fields in the market individually would not only be time-consuming but could also lead to confusion. Therefore, we need to classify all farm outputs from different rice varieties based on their management methods (i.e., video duration), simplifying the analysis and establishing a reasonable basis for comparison.
We can anticipate that more creators tend to publish shorter videos, whereas the number of longer videos is significantly smaller. As a result, video durations are not evenly distributed across video quantities. To establish a simple yet relatively reasonable categorization for video durations, we adopted the following intervals: ‘0-1’, ‘1-2’, ‘2-3’, ‘3-4’, ‘4-6’, ‘6-10’, ‘10-15’, ‘15-30’, and ‘30+’ minutes.
Using this classification, we created a pie chart showing the distribution of videos across these duration intervals. The results reveal a relatively balanced distribution of video quantities across different durations, providing a solid foundation for subsequent analyses of video performance across various durations.
General Trends
Surveying the Fields
First, we aimed to conduct an overall analysis that is not specific to any particular category.
Under various popularity score weights settings, we observed similar conclusions. From the chart, it is evident that after 2013, videos with a duration of 10-15 minutes showed a significant upward trend, becoming the mainstream on YouTube. In contrast, videos with a duration of 0-1 minutes performed poorly, significantly lagging behind other durations.
This phenomenon is partially attributable to changes in YouTube’s advertising model. In 2013, YouTube redefined its advertising strategy, notably introducing the skip ad feature. The combination of skippable and non-skippable ads, along with the platform allowing creators to insert mid-roll ads in addition to pre-roll ads, provided more monetization opportunities for creators.
- For instance, content creator Shelby Church shared that by extending her video length from 7 minutes to 13 minutes, her monthly income skyrocketed from $1,800 to $6,000. Surprisingly, she discovered that longer videos not only generated more revenue but also attracted more viewers, creating a win-win situation. This further incentivized YouTubers to produce longer content.
Additionally, the rise of short-video platforms also played a crucial role in shaping this trend. According to Pew Research Center, the average video duration from the top 250,000 channels has increased to 13-14 minutes.
The popularity of short-video platforms drew the attention of 0-1 minutes video enthusiasts, who gradually migrated to other platforms to satisfy their viewing preferences.
Meanwhile, YouTubers shifted their focus to producing higher-quality and more in-depth 10-15 minutes videos to attract the audience that remained on the platform.
This duration has become the core content format for YouTube amid the short-video boom. This shift reflects not only an adaptation to changes in the advertising mechanism but also a response to the evolving platform ecosystem and audience preferences.
Category–Specific Trends
Targeting Different Seeds
But you may wonder whether this conclusion applies equally to all types of rice varieties (e.g., Long-Grain Rice, Jasmine Rice, Riso Camolino, Basmati Rice). What if the type of rice you are growing doesn’t follow this pattern?
Similarly, can we conclude that this trend is reasonable for all videos? It is difficult to make such a sweeping judgment. Therefore, we categorized videos by their respective categories and analyzed the video duration of each category.
ANOVA of Duration on Popularity Score of Different Categories from 2005 to 2013
| Category | F Statistic | P Value | Effect Size | Is Significant |
|---|---|---|---|---|
| Autos & Vehicles | 2.271834 | 0.034062 | 0.994386 | False |
| Comedy | 5.322115 | 0.000046 | 1.643237 | True |
| Education | 0.802912 | 0.602486 | 0.251685 | False |
| Entertainment | 2.635134 | 0.015055 | 0.776133 | False |
| Film & Animation | 2.338248 | 0.029894 | 0.707231 | False |
| Gaming | 0.566977 | 0.800421 | 0.098162 | False |
| Howto & Style | 2.347927 | 0.028791 | 0.714222 | False |
| Music | 4.592627 | 0.000210 | 1.297670 | False |
| News & Politics | 1.597982 | 0.144183 | 0.204284 | False |
| Nonprofits & Activism | 1.381251 | 0.226676 | 1.448956 | False |
| People & Blogs | 1.603758 | 0.141732 | 0.165495 | False |
| Pets & Animals | 1.567386 | 0.156076 | 0.403870 | False |
| Science & Technology | 2.646171 | 0.015167 | 0.766724 | False |
| Sports | 2.500226 | 0.020932 | 0.678565 | False |
| Travel & Events | 2.923431 | 0.007999 | 0.754287 | False |
ANOVA of Duration on Popularity Score of Different Categories from 2014 to 2019
| Category | F Statistic | P Value | Effect Size | Is Significant |
|---|---|---|---|---|
| Autos & Vehicles | 68.584344 | 1.210359e-22 | 1.737613 | True |
| Comedy | 19.136629 | 3.863540e-12 | 2.050515 | True |
| Education | 14.932096 | 2.134210e-10 | 0.203852 | True |
| Entertainment | 24.369610 | 5.958979e-14 | 1.659198 | True |
| Film & Animation | 16.355574 | 5.064795e-11 | 1.351374 | True |
| Gaming | 30.413594 | 1.067309e-15 | 1.028934 | True |
| Howto & Style | 66.568959 | 2.234163e-22 | 1.017722 | True |
| Music | 11.850955 | 6.790836e-09 | 1.173022 | True |
| News & Politics | 19.535482 | 2.732512e-12 | 3.181898 | True |
| Nonprofits & Activism | 1.506203 | 0.1820193 | 0.464466 | False |
| People & Blogs | 21.186864 | 6.871131e-13 | 1.818957 | True |
| Pets & Animals | 8.308367 | 7.752719e-07 | 0.999492 | True |
| Science & Technology | 19.393595 | 3.088956e-12 | 1.013175 | True |
| Sports | 14.978425 | 2.033656e-10 | 1.911029 | True |
| Travel & Events | 37.327544 | 2.236804e-17 | 0.053321 | True |
The significance analysis of duration before and after 2013 shows that, before 2013, the video duration had no significant effect on performance in most categories except for Comedy. However, after 2013, all categories, except for Nonprofits & Activism, showed significant results, indicating that video duration had a significant impact on video performance.
Compared to other categories, comedy has had a longer development time.
Past
In the past, people had the opportunity to engage in comedy-related activities offline which had already required the creators to optimize video length to meet audience demands.
Future
Now with the shift to online platforms like YouTube, comedy enthusiasts have developed established preferences that remain consistent on YouTube, making it less influenced by the short-video culture but consistently have a preference for a specific duration.
While audiences in the Nonprofits & Activism category typically have a clear goal, such as obtaining key information or supporting a cause, rather than enjoying the content itself. Therefore, the impact of video length on viewing performance is relatively small.
For the categories where video duration had a significant impact after 2013, further research will be conducted.
2014-2019 Best and Worst Performing Durations by Category
| Category | Best Performing Duration | Worst Performing Duration |
|---|---|---|
| Autos & Vehicles | 15-30 | 0-1 |
| Comedy | 10-15 | 0-1 |
| Education | 10-15 | 1-2 |
| Entertainment | 15-30 | 0-1 |
| Film & Animation | 10-15 | 0-1 |
| Gaming | 10-15 | 0-1 |
| Howto & Style | 10-15 | 1-2 |
| Music | 30+ | 1-2 |
| News & Politics | 6-10 | 0-1 |
| People & Blogs | 10-15 | 0-1 |
| Pets & Animals | 10-15 | 0-1 |
| Science & Technology | 10-15 | 30+ |
| Sports | 10-15 | 0-1 |
| Travel & Events | 15-30 | 2-3 |
It can be observed that the optimal video duration for most categories is around the 10-15 minute range, while the worst-performing videos are typically in the 0-1 minute range. This is consistent with the overall trend we mentioned earlier.
However, there are exceptions. In the Music category, the optimal duration is unusually longer, reaching over 30 minutes. This may be because a large portion of the audience in the Music category seeks long videos, such as several hours of white noise or other music, as continuous background sound for activities like sleep, studying, working, or exercising. These viewers may not like the interruptions from frequent switching between short videos. Additionally, fans of specific artists or albums may also feel more attached to longer videos.
Moreover, the worst-performing videos in the Science & Technology category also come from the 30+ minute range. The popularity of short videos may have made people more impatient and unwilling to focus on lengthy and potentially monotonous science and technology content. Long Science & Technology videos may fail to continuously provide engaging content to hold viewers’ attention.
Long videos in this category (such as those related to ADA 🤫) often require a certain level of knowledge, increasing the viewing threshold for the audience.
However, we also found another interesting phenomenon. When observing the best-performing videos in each year based on specific criteria (most views, most likes, most comments, and highest popularity), we find that the top videos tend to be shorter.
In other words, videos around 10-15 minutes long are most likely to help YouTubers achieve better video performance, but if your goal is to be number one, then you should focus on trying short videos.
Content Strategies Analysis
Specialized Seeds or Not?
Congratulations! 🎉 As a rice field farmer, you have successfully identified the optimal growth cycle for your rice 🧑🌾. However, you now face another dilemma: different rice varieties cater to different audiences. Should you plant multiple rice varieties to expand your farm’s influence, or should you specialize in cultivating a single variety and become an expert in that field? Particularly under the influence of this new rice farming method, the answers to these questions might be entirely different. Moreover, the consequences of these choices could be significant and irreversible, leaving you cautiously indecisive.
Don’t worry, let’s take it step by step to make some informed judgments.
Based on the previous analysis, we can conclude:
- Under the impact of short videos, YouTubers from different categories need to adjust their video lengths according to their specific circumstances to improve audience engagement and performance.
- At the same time, the rise of short videos has lowered the barriers for creators to experiment with different categories.
- Furthermore, short video platforms have distinct advantages in certain categories, prompting us to further analyze how YouTubers should adapt their strategies within different categories.
Could this phenomenon have a profound impact on YouTubers’ content strategies and their long-term development?
Specifically, as audience demands become increasingly diverse, the challenge of attracting subscribers has grown more complex for creators. For YouTubers within a specific category, their subscribers can generally be divided into the following groups:
Audiences Aligned with Video Length
These audiences have preferences that align with the video's duration, making it easy for creators to meet their expectations.
Audiences Not Aligned with Video Length
These audiences may find it difficult to engage with videos that don't match their expected length, leading to reduced satisfaction.
Audiences from Other Categories
Audiences from different categories may have different content preferences, and their engagement may not depend on video length.
Once the optimal video length for a category is determined (disregarding the impact of video quality), YouTubers aiming to further grow their subscriber base may need to attempt to attract audiences from other categories. However, in the process of appealing to audiences from different categories, could the combination of two categories create a mismatch that leads to the loss of the original audience?
This brings us to a key question: Can YouTubers diversify their channels by integrating content from different categories to attract more viewers? This is directly tied to the choice of channel strategy—should creators focus on a single category or mix content from different categories?
Strategy Impact Overview
Learning from Successful Fields
First, we give three mathematical definitions:
-
Channel Content Diversity (Shannon’s Entropy):
For a channel’s content categories:
\(H = -\sum_{i=1}^{n} p_i \ln(p_i)\), where:
\(H\) = Shannon’s diversity index, \(p_i\) = proportion of videos in category \(i\), \(n\) = total number of categories
-
Engagement Rate:
\(ER = \min(\frac{L}{V} \times 100, 100)\), where:
\(L\) = likes, \(V\) = views
-
Growth Rates:
Weekly growth rates:
\(G_s = \frac{S_f - S_i}{w}, G_v = \frac{V_f - V_i}{w}\), where:
\(G_s\) = subscriber growth rate, \(G_v\) = view growth rate,
\(S_f, V_f\) = final values, \(S_i, V_i\) = initial values, \(w\) = number of weeks
Then, we selected channels that we consider relatively successful for analysis (just as a farmer would prefer to study successful farms). Here, “successful” is defined as channels whose average performance across four metrics—view count, engagement rate, weekly subscriber growth, and weekly view growth—ranks in the top 25% of all channels.
We also defined three strategies: specialized, mixed, and diversified, which represent the proportion of videos from the most dominant category within a creator’s channel, divided into three ranges: 0.7-1.0, 0.4-0.7, and 0-0.4, respectively.
Specialized
0.7-1.0
mixed
0.4-0.7
diversified
0-0.4
Engagement and Growth Metrics by Strategy and Success Levels
From the chart, it is clear that the majority of successful channels have adopted the specialized strategy. Even after altering the criteria for defining “successful” and adjusting the classification standards for strategy proportions, the same conclusion was observed. Therefore, for the subsequent analysis, we focus specifically on the top 25% and the three strategy ranges: 0.7-1.0, 0.4-0.7, and 0-0.4.
The consistency of these results suggests that, overall, adopting a specialized strategy—focusing on attracting a fixed audience -- is the most favorable choice for creators. However, when it comes to individual creators, is this conclusion universally applicable? Not necessarily.
By analyzing the proportion of videos in different categories under different strategies for successful channels, we gained some initial insights: certain types of content seem better suited to specific strategies. For example, Film & Animation channels have a success rate of only 0.03% under the specialized strategy but a significantly higher success rate of 22.6% under the diversified strategy. This might suggest that the category aligns better with the specialized strategy. But is this truly the case?
To answer this, we calculated the impact of strategies on various factors across different categories. For those categories significantly affected by strategy, we compared the mean values under the three different strategies to determine which strategy performs best.
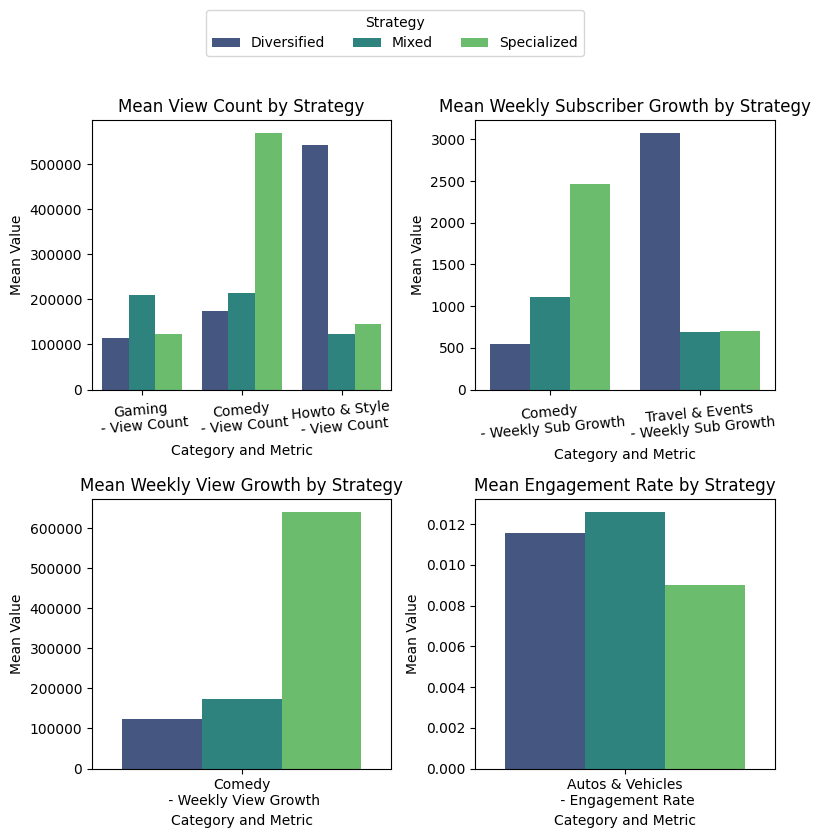
From the bar chart, we can infer that:
- The specialized strategy is best suited for channels in the Comedy category, as viewers tend to prefer specific content styles. Thus, adopting a specialized strategy can effectively boost view counts and subscriber growth.
- The mixed strategy works well for channels in the Gaming and Autos & Vehicles categories, as these channels need to strike a balance between diversity and focus to attract a broader audience.
- The diversified strategy is more suitable for channels in the How-To & Style and Travel & Events categories, where audiences have a high demand for varied content. By adopting a diversified strategy, creators can capture the interest of a wider range of viewers.
At the same time, the rise of short videos has lowered the barriers for creators to experiment with different categories. Furthermore, short video platforms have distinct advantages in certain categories, prompting us to further analyze how YouTubers should adapt their strategies within different categories.
Strategy Selection Across Categories
Determine the Seeds!
After gaining an understanding of the overall picture, it’s time to decide which rice varieties to cultivate 🌾! Under the impact of the new rice field management methods, we aim to explore whether to add, reduce, or maintain the variety of rice being planted to attract more customers in the market. In other words, we want to determine whether short videos have influenced channel strategies by examining the choices of channel strategies before and after 2013.
According to the data, in 2014, compared to 2012, the proportion of the diversified strategy decreased by approximately 70%, while the mixed strategy dropped by about 35%. In contrast, the specialized strategy increased by around 10%. This trend indicates that after the rise of short videos, YouTube audiences have shown a stronger preference for channels with a more focused content selection. To analyze strategies for each specific category, we conducted an Analysis of Variance (ANOVA) to determine whether strategies had a significant impact on categories before and after 2013, and identified the significant results.
The results indicate that before 2013, Autos & Vehicles, Entertainment, and Travel & Events were best suited to the diversified strategy, while Comedy was better suited to the specialized strategy. After 2013, Comedy remained best suited to the specialized strategy, and Travel & Events continued to align with the diversified strategy.
However, the impact of strategy on the Autos & Vehicles category was no longer significant, and Entertainment shifted from being suited to the diversified strategy to the mixed strategy. Additionally, categories such as Education, Science & Technology, Nonprofits & Activism, How-To & Style, and News & Politics began to show significant sensitivity to strategy.
How has the rise of short-video culture contributed to the changes or maintenance of these optimal strategies? We aim to explore the following key questions.
-
The Exclusivity of Comedy 🎩:
Before and after 2013, the Comedy category consistently aligned with the specialized strategy, which is closely tied to the reliance of comedy content on YouTubers’ personal styles (e.g., types of humor, performance techniques, etc.). Viewers’ emotional attachment to consistent content styles, combined with the rise of short-video platforms, reinforced their preference for concise, distinctive content. This drove YouTubers to focus on specific formats such as mimicry, stand-up comedy, or situational sketches to establish strong brand recognition. Additionally, the high-frequency, short-form content of these platforms intensified audience attention fragmentation, compelling YouTubers to maintain consistent styles to stand out in a competitive environment.
-
The Consistent Versatility of Travel & Events 🧳:
The Travel & Events category has consistently aligned with the diversified strategy. This category encompasses a wide range of themes, such as culture, cuisine, and adventure. YouTubers expand their reach by incorporating content from other categories (e.g., entertainment or practical guides), attracting audiences who are not only interested in travel content but also engaged with other types of content, thereby maximizing their audience base.
-
The Gradual Focus of Entertainment 🎮:
In the early stages, the Entertainment category was aligned with the diversified strategy, where YouTubers attracted a diverse audience by publishing videos from multiple categories (e.g., News & Politics, Gaming). However, with the rise of the short-video wave, audiences began to prefer high-frequency, entertainment-focused content. As a result, YouTubers gradually shifted toward a mixed strategy, increasing the proportion of entertainment content while retaining a moderate level of diversity to satisfy fixed audience preferences and avoid monotony-induced viewer fatigue.
-
The Shifts Among Others 📺️:
After 2013, the impact of strategy on the Autos & Vehicles category became less significant due to its stable audience demand, which is primarily focused on specific themes such as reviews and modifications. In contrast, categories such as Education, Science & Technology, Nonprofits & Activism, How-To & Style, and News & Politics began to show significant sensitivity to strategy. This reflects the diversification of audience preferences and the maturation of the content market. Creators in these categories need to select strategies based on their unique characteristics, such as adopting a diversified strategy to broaden their reach or using a mixed strategy to balance content across multiple categories and enhance performance.
It is evident that the rise of short videos, combined with the inherent characteristics of each category, has jointly driven changes in strategy. This also addresses the initial question posed in this section:
Can YouTubers diversify their channels by integrating content from different categories to attract a broader audience? Should creators focus on a single category or mix content from multiple categories? 🤔
The answer is not absolute: it depends on the specific characteristics of the category and the external influences at a given point in time. 🤠
Conclusion
YouTubers who have faced the wave 🌊 of short videos have indeed spontaneously developed some coping strategies (especially the relatively successful ones). Most of them have chosen a video duration of around 10-15 minutes while simultaneously reducing the diversity of their video topics. For some special categories (such as Comedy, Nonprofits & Activism, and Travel & Events), we conducted targeted analyses.

We hope you’ve learned some methods to navigate the “impact of new management measures” from the above analysis. As of now, in 2024, even greater challenges are still affecting your “field.” By reflecting on past experiences from your “farm,” you may have gained some insights into planting strategies. It’s likely that you now have new thoughts on the choice of planting methods and the diversity of crop varieties in your rice field.
🧑🌾 Give it a try and manage your rice field well! 🌾